The results panel consists in two part: the tool panel on top and the view panel below. Two views are available from iRegulon plugin with their corresponding parameters discussed here in this manual: the Motif View and the Transcription Factor View.


On the top left, of the Tool panel is the name of the analysis. The parameters of the analysis can be seen when the user put the mouse over this title.
This option will add all the target genes and the selected transcription factor to the current network. Edges will be add to the network between the transcription factor and the target genes. This is visualised in the iRegulon Visual Style. The selected view won't be changed.
This option will create a new window in the view, and create a new network. The name of the new network is the name of the selected transcription factor with the name of the selected motif. The selected transcription factor and all target genes will be shown. Also the interaction between these (between the TF and the TG) is drawn. This is visualised in the iRegulon Visual Style.
This option will allow the user to query the metaregulons of the selected TF using our TF-Target database(see query).
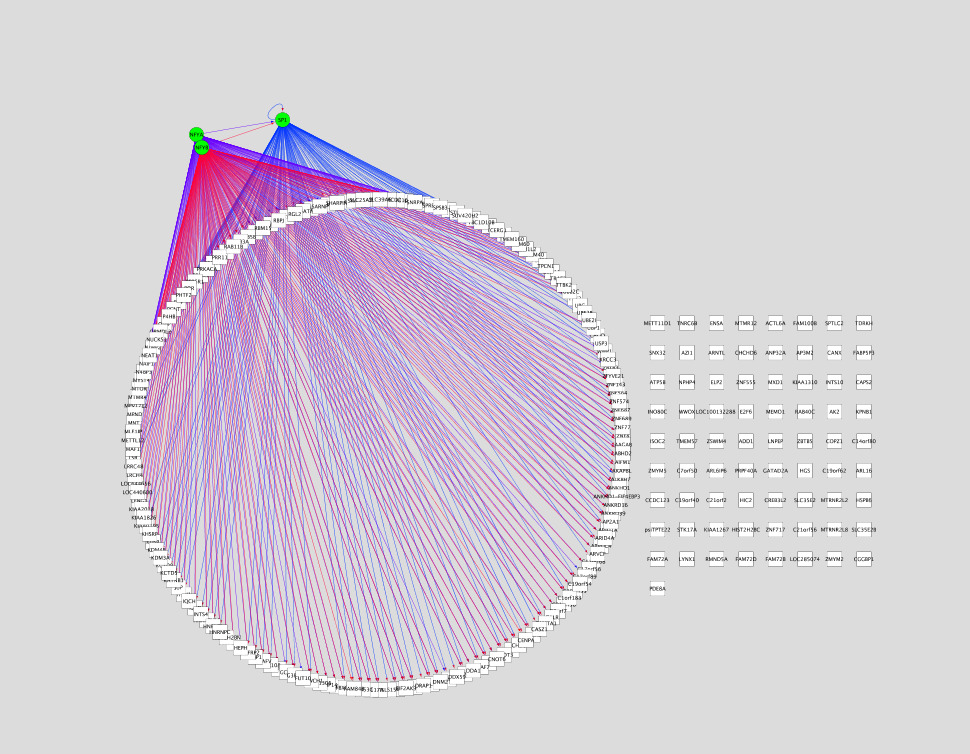
This option will create a new network with the merge of all TF-target gene interactions (one edge per each). The new network will keep the same layout, but the motif information is lost with the edge color.
This menu will show the selected TF and will allow the user to scroll over the predicted TFs.
This menu allows the search of a motif, TF or target gene in the results. The results having the relevant information will be checked in the filter column of the main view table (TF Table in TF view or Motif Table in Motif view).
This button will import the results in the iRegulon format (.irf).
This button will save the results in the iRegulon format (.irf).
This button will export the results in a tab-delimited text file (.txt).
This button will close the current results tab and will ask if the user wants to save the results.
![]() For Cytoscape 2.8.x :
For Cytoscape 2.8.x :
This style draws all target genes as squares. The TF is shown as a green ellipse. The interactions are drawn with directed edges from the TF to the target genes. Edges corresponding to the same motif have the same color.
![]() For Cytoscape 3.1.x :
For Cytoscape 3.1.x :
This style draws all target genes as pink ellipses. The TF is shown as a green octagon. The interactions are drawn with directed edges from the TF to the target genes. Edges corresponding to the same cluster have the same cluster color. Circular layout is applied when a new network is drawn or if current network has no edges.

This is linked with the search option. The results having the relevant information will be checked in this filter column. By clicking on the column name, the results will be sorted with the filtered rows on top or bottom of the table.
This column corresponds to the rank according to the NES score.
The ID of the motif. In general, it corresponds to the source motif database (e.g. transfac_pro, Flyfactorsurvey) and the source ID of the motif.
This column corresponds to the enrichment score of the motif or the maximal enrichment score for a given TF (in TF view).
This is the Area Under the Curve that is calculated in the cumulative enrichment plot. The AUC is used for the calculation of the enrichment score
The enriched motifs are clustered by similarity and similar motifs that belong to the same cluster will have the same cluster code and the same background color. The cluster code is given by order of maximal NES per motif cluster. Cluster code starting by "M" corresponds to motif cluster and code with "T" to track cluster.
This column indicates the number of target genes selected for the given motif.
This column indicates the number of TFs that can be associated by the motif2TF algorithm to the given motif.
The motif from the selected row is displayed as a motif logo (see weblogo). This logo corresponds to the annotated PWM. Name and link to the source database when possible is added to the description.
Right-click on the logo image to save it to PNG file.
Gene ID of the predicted Transcription Factor
Right-click on it, and click on details to get more description about the motif2TF prediction.

This %identity was calculated in EnsemblCompara gene trees based on whole amino acid sequence alignments (tf2tf associations). The closer the score to zero, the more homologous genes can be associated to an annotated TF. But when the threshold is set to zero, no orthologous information is used. This score must be between 0 and 1. "N/A" indicates that orthology identity is not used (e.g. motif annotated for a TF in the same species).
This is the FDR calculated by the TOMTOM p-value for the similarity of the motifs (motif2motif associations). The closer the score to zero, the more similar the motif is to the enriched motif. The score must be between 0 and 1. "Direct" indicates that the motif is directly annotated and no motif similarity was used.
This is the rank of the target genes according to the score using the selected enriched motif. Top genes are best targets.
This is the gene name of the targets. The targets that are in the current network are highlighted in red.
The Track view shows the enriched regulatory tracks (Transcription Factor, cell line, treatment), similarly as the Motif View.
Consequently, the track view doesn't display motif logo or predicted Transcription Factor from motif2TF. The annotated Transcription Factor (ChIP'ed TF) is then shown in the TF table. Tracks can be clustered if they are associated to the same TF.
The ID of the Transcription Factor.
This column indicates the number of motifs or tracks that can be associated by the motif2TF algorithm to the given cluster.